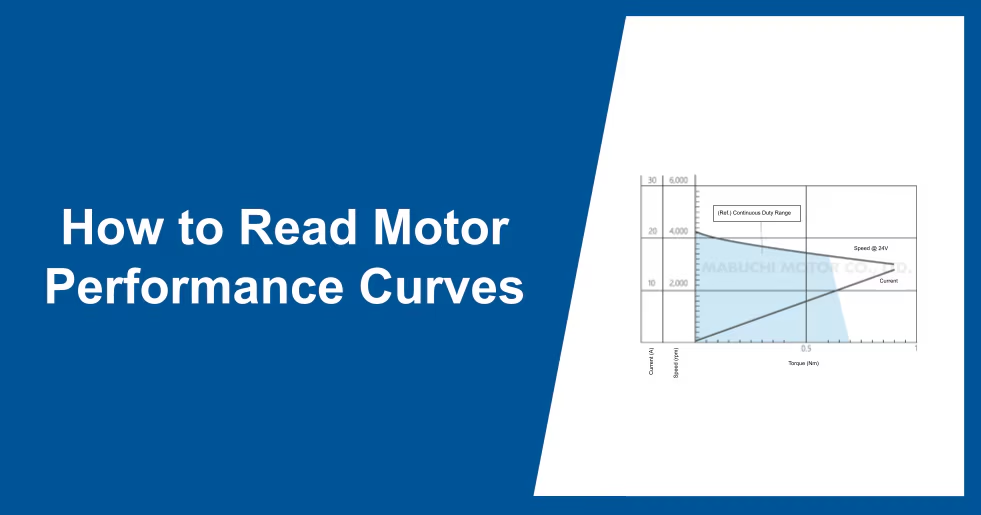
This article explains how to read motor performance curves. Also known as T-N or N-T characteristic diagrams, these graphs show the relationship between a motor's torque, speed, and current.
At first glance, they might seem a bit intimidating. However, once you understand the basics, you'll see they're a useful tool for visualizing a motor's characteristics.
Let's walk through the key points using a performance curve for a real brushless motor.
Key Terminology

The chart above is a color-coded version of the performance curve for the "IS-74BZA" brushless motor, operating a its rated voltage of 24V.
To read these curves, you first need to understand two important lines: the T-N characteristics and the T-I characteristics. (For a refresher on basic motor performance terminology, such as "torque" and "speed," please refer to this article.)
T-N Characteristics
The T-N characteristics illustrate the relationship between torque and the rotational speed achievable at that torque. It is also referred to as a T-N curve.
Generally, as torque increases, rotational speed decreases, resulting in a downward-sloping curve.
The right end of the line breaks off at the9 Nm torque point, indicating that the motor can produce up to 0.9 Nm (instantaneous maximum torque). The rotational speed is highest under no-load conditions (when torque is zero); this is known as the no-load speed [N0].
T-I Characteristics
The T-I characteristics (T-I curve) illustrate the relationship between the current flowing through a motor and its torque, ranging from no-load (zero torque) to instantaneous maximum torque. This is often referred to as the T-I curve.
Generally, as torque increases, the current required also increases, resulting in an upward-sloping curve.
The slope of the T-I characteristic curve is known as the torque constant [Nm/A]. The relationship between torque and current can be expressed by the following equation:
Formula: Torque T [Nm] = Torque Constant [Nm/A] × Current I [A]
Theoretically, the current at no-load (zero torque) should be zero. However, in practice, a small current flows due to iron loss* and mechanical loss*. Therefore, the no-load current [I0] in the performance curve is slightly greater than zero.
● Iron Loss: Power loss consumed as heat due to changes in the magnetic field and eddy currents in the iron core.
● Mechanical Loss: Power loss consumed as heat due to mechanical friction and air resistance.
How to Read a Performance Curve

Let's continue using the IS-74BZA performance curve.
If you know any one of the three primary values (torque, speed, or current), you can determine the other two from the graph.
For example, here’s how to find the speed and current if the motor needs to handle a torque of 0.5 Nm.
Finding Speed and Current at 0.5 Nm Torque:
- Find 0.5 Nm on the horizontal torque (T) axis.
- Move up to the T-N characteristic line. The corresponding value on the vertical speed (N) axis is approximately 3,400 r/min.
- Now look at the T-I characteristic line at that same 0.5 Nm point. The corresponding value on the vertical current (I) axis shows that approximately 8A of current is required.
You can also calculate the output power using the following formula:
Power P [W] = 2π × Torque T [0.5 Nm] × Speed N [3,400 r/min] ÷ 60 ≈ 178 W
At this point, the motor's output is about 178W.
While this example started with a specific torque, you can start from any value. For instance, if you set the rotational speed to 3,400 r/min, it can be understood that the motor will deliver a torque of approximately 0.5 Nm, and the current at that time will be about 8 A.
You can learn more about the relationship between torque, speed, and power in this article.
Important Considerations
Continuous Duty Range
Motors generate heat. This heat comes from copper loss* (as torque and current increase), iron loss* (as speed increases), and mechanical loss (from friction and air resistance). If the motor's temperature gets too high, it can affect safe and stable operation.
For this reason, motor performance curves define a continuous operable range, shown as the light blue area in the graph below.
● Copper Loss: Electrical power loss converted into heat due to the electrical resistance in the coil windings.
● Iron Loss: Electrical power loss that occurs when the magnetic field in the iron core changes, converting into heat from magnetic and eddy currents.

For example, if you need to run this motor continuously with a torque load of65 Nm, here's how you'd find the maximum allowable speed for continuous duty at 0.65 Nm:
- Find the point on the 0.65 Nm torque line that is at the very top edge of the continuous operable range.
- Looking at the vertical speed (N) axis, you can see that the speed must be kept at or below 1,600 r/min for continuous operation.
Running the motor beyond its continuous duty range for an extended period can lead to malfunction or failure, so be careful.
Applied Voltage
Motors are designed to be used at their rated voltage for safe, continuous operation. The values shown on a standard performance curve assume the motor is running at this voltage. Rated Voltage refers to the recommended voltage for continuous and safe operation.
Remember that changing the applied voltage will also change the current, torque, and speed values. Always make sure the voltage of the performance curve you are looking at matches the voltage you plan to use for the motor.
Reference: Brushed Motor Performance Curves

Terms like output, efficiency, stall torque (Ts), and stall current (Is) may appear on brushed motor performance curves. However, the basic interpretation remains the same as with brushless motors.
Torque reaches its maximum when the motor stops rotating due to an increased load; this is known as a stall. The torque value at this point is called stall torque (Ts), and the current value is represented as stall current (Is). It's important to note that brushless motors are often designed to prevent currents large enough to reach stall torque, as this protects the control board. Therefore, stall torque and stall current are generally not listed on brushless motor performance curves.
Additionally, output and efficiency can be calculated from torque, rotational speed, current, and voltage values. For this reason, output and efficiency lines may sometimes be omitted. To accurately determine efficiency (%), a power meter is required. Therefore, please use the efficiency line on performance curves as a general guide.
Summary
In this article, we've covered how to read motor performance curves. These graphs are handy for understanding a motor's characteristics and selecting the right model for your application. Mabuchi Motor offers a diverse lineup of brushless motors for various applications. On each product page, you'll find both a specifications table and a performance curve to help you in your design and development process.